The Climate & Ecological Emergency Bill

The Climate and Ecological Emergency (CEE) Bill was introduced to Parliament as a Private Members Bill on 2nd September 2020.  Guided by the current science, this Bill has been written by an alliance of scientists, lawyers academics and campaigners, in the hope of securing a sound strategy to reduce greenhouse gas emissions and restore the natural world, to try to prevent catastrophic climate change

Nature is our life support system – it provides food, water, medicine, pollination, helps regulate the climate and flood prevention, and boosts our mental health.  it is essential for our wellbeing.   But we have been living beyond the means of our planet and eroded natural resources, to such an extent, that habitats have been destroyed or polluted and wildlife is struggling to survive.  Scientists fear that the sixth mass extinction is underway.

In the UK alone:

  • 41% of all UK’s species have declined since the 70s (hedgehogs have declined by 95%)
  • 26% of the UK’s mammals are at a very real risk of becoming extinct
  • A third of the wild bees and hoverfly species have sustained losses, likely due to pesticides, habitat loss and climate change
  • 97% of the UK’s wildflower meadows have been lost

(State of Nature report 2019)

The CEE Bill requires urgent action to reduce the negative impacts that human activities have had on the health of soil and biodiversity and restore and enhance nature, so that it wildlife and ecosystems can thrive.  When they are healthy, living systems such as forests, peat bogs, saltmarshes and the sea bed, support life and absorb carbon from the atmosphere, which can help tackle the climate emergency too.  The Bill also outlines new targets for the UK to reduce its real fair share of carbon emissions, in line with the spirit of the Paris Agreement. You can read more about it here.

For the Bill to suceed it will require cross-party support and all MPs to unite behind it.   We need to all come together, to act for the common good.  The future of our children, their children and countless species is in the balance.

Please write to your MP asking them to support the CEE Bill.

We Do Not Have A Free Press

Overnight on Friday, 4th September, over 100 rebels blockaded newspaper printers overnight, successfully preventing The Sun, Daily Telegraph, Daily Mail and Times from reaching newsstands all over the country.

In one of Extinction Rebellion’s most coordinated and disruptive actions to date, rebels simultaneously took site in Broxbourne, Liverpool and Glasgow with fantastically effective roadblock structures.

The media has a vital role to play in telling the most urgent story of our time – the climate and ecological emergency. We desperately need them to stop spreading hatred and lies, and instead take a real lead to help us come together to hold our government to account.

‘Priti Patel has accused us of making an “attack on free press, society and democracy”. That’s hyperbolic for sure. But let’s not get distracted. Our free press, society and democracy is under attack – from a failing government that lies to us consistently, is becoming increasingly authoritarian, and is leading us towards 4 degrees of warming.

Priti Patel and her government are part of a political system that does not want and does not benefit from a free press. Instead our leaders have allowed the majority of our media to be amassed in the hands of five people with powerful vested interests and deep connections to fossil fuel industries. [1] Powerful vested interest has led to the appointment of Tony Abbott – a friend of Rupert Murdochs, a climate change denier, misogynist and homophobe – as a UK Trade Envoy. Our leaders are allowing these powerful few to deny the young the information they need to plan for their futures and defend themselves. ‘ (from XR Press release 5.9.20)

A free press is vital. But UK mainstream media is not ‘free’ press. It is owned by a few billionaires whose agenda is not holding government & powerful institutions to account for their negligence in failing to act to protect its citizens.

For democracy to work, people need to be in possession of the facts.

[1] BBC documentary The Rise of the Murdoch Dynasty. https://www.bbc.co.uk/iplayer/episodes/m000kxw1/the-rise-of-the-murdoch-dynasty

Mad Hatter’s Tea Party!

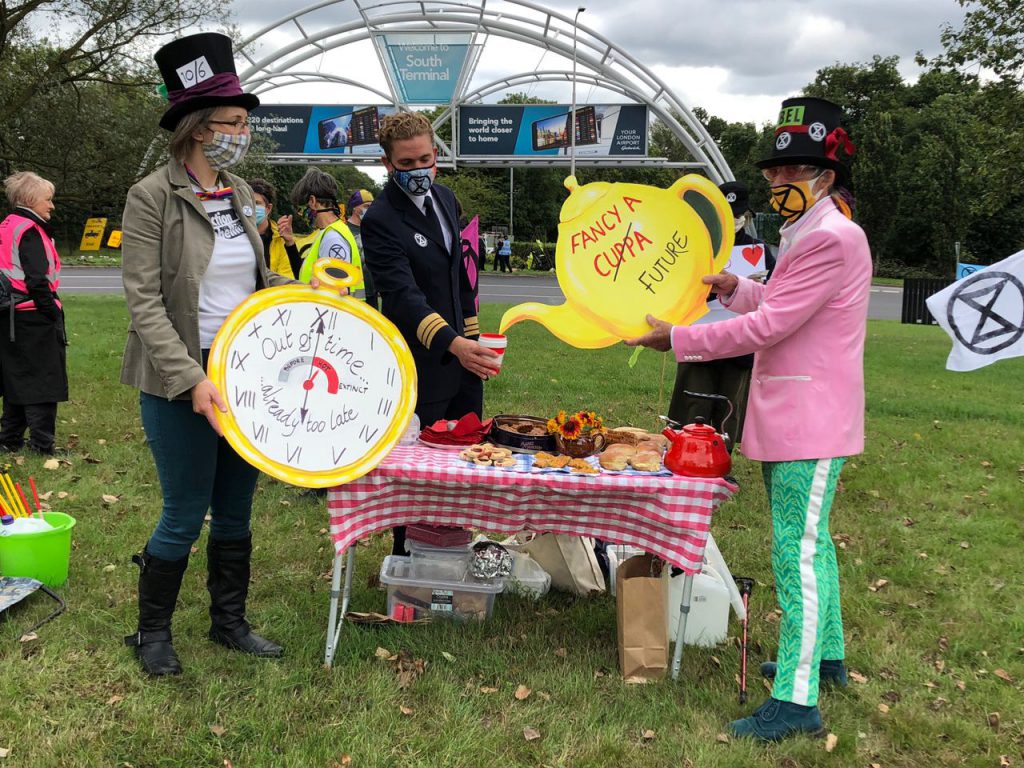
Local rebels joined a Mad Hatter’s Tea Party outside Gatwick Airport yesterday to protest against the high carbon footprint of the airline industry.

Less than 10% of the world’s population has ever been on a plane. Yet the airline industry is the fastest growing source of greenhouse gas emissions.

Rebels in fancy dress were joined by a former pilot who left the airline industry, for which he had worked for a number of years, as he felt that he could no longer support the carbon-intensive industry.

The Rebel Riders, en route from Brighton to London, arrived to the sight of rebels performing Discobedience in the centre of the roundabout!

Fossil Fuels Are Killing Us

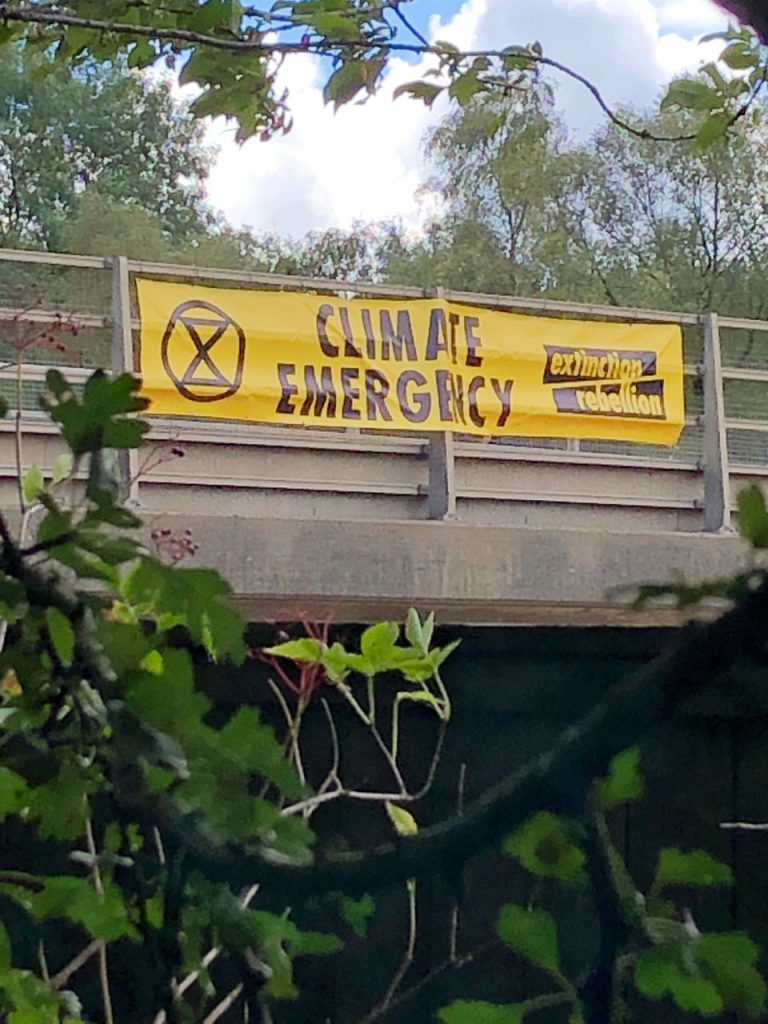
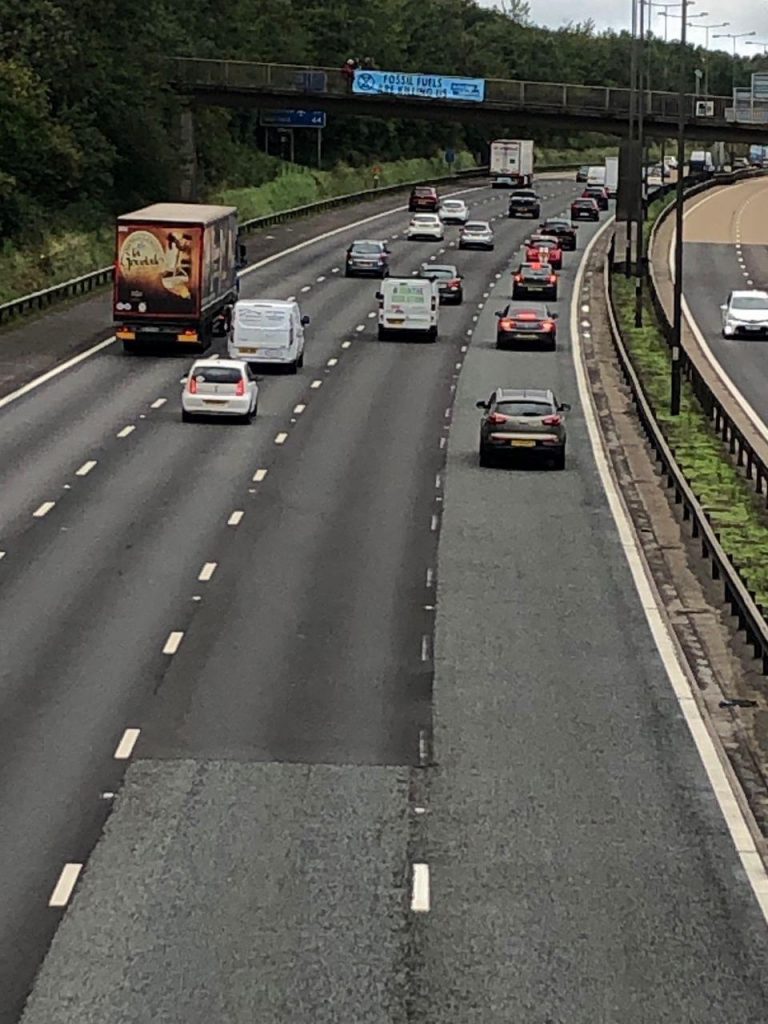
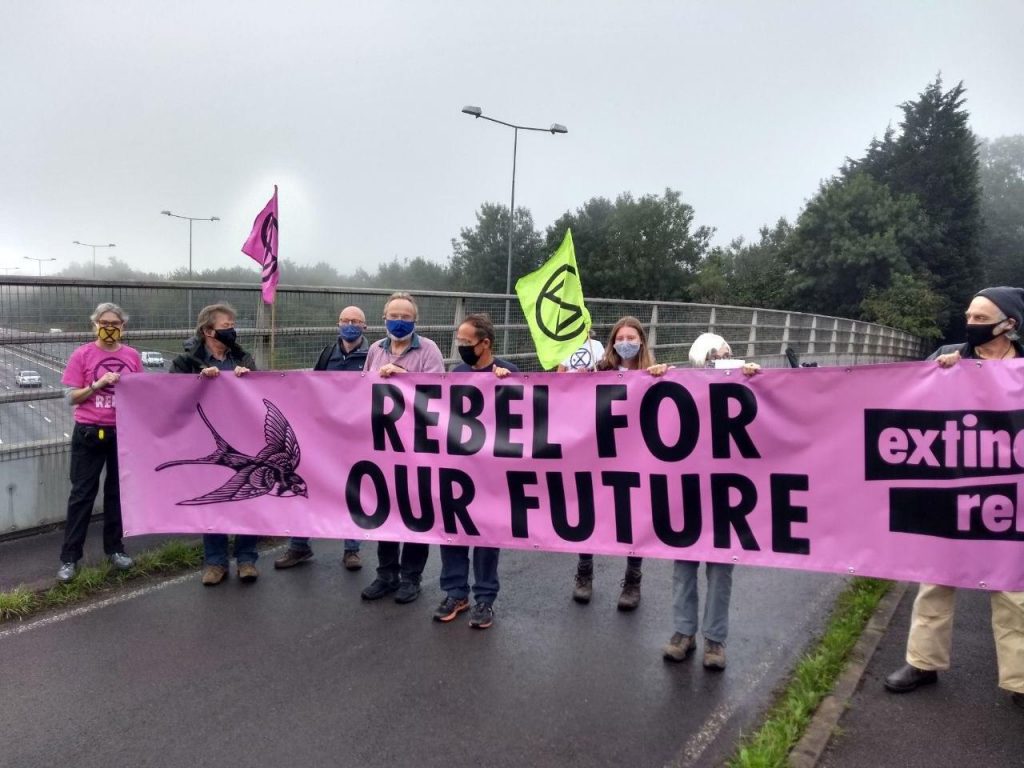
On Friday we joined Extinction Rebellion groups across the country in a nationwide banner drop, as part of a fossil fuel-focused day of action.  Six banners hanging on three bridges across the M25, spread our message to thousands of travellers, in the constant stream of heavy traffic throughout the day.

Every breath we take

BACKGROUND
Air pollution is one of the largest environmental risks to public health in the UK and contributes to shortening and reducing the quality of life for thousands. 40,000 deaths a year are estimated to arise from air pollution. Fine particulate matter (PM2.5) is widely understood to be the pollutant that is the most damaging to health and nitrogen dioxide has been identified by The European Environment Agency as the cause of 11,940 premature deaths in 2013 in the UK.
Air quality and climate change are intimately connected, with many common causes. Making major improvements to air quality will make an important contribution to reducing the threat of climate change.
Locally, data on air quality has until recently been limited to a small number of static monitors which measure nitrogen dioxide levels. Data on the levels of other pollutants can only be estimated based on readings from a number of monitoring stations which are outside the area and in some cases 75 miles away.. Data which is limited in scope, difficult to access and some of which is poor-quality hinders public awareness of air quality issues and limits corrective action.

The lockdown implemented as a consequence of Covid-19 presented a unique opportunity to measure air quality in favourable circumstances. Further programmes of measurement will establish the extent to which pollutants are increasing and in which local areas.

The onset of Covid-19 has raised the issue of air pollution to new heights with national and international studies to investigate the connection between nitrogen dioxide, PM2.5 and the transmission of coronavirus and the extent to which the recovery of Covid –19 patients is adversely affected by air pollution.

WHAT WE DID

Measuring air quality during Covid-19 lockdown (the period from mid-April to early May) provided a benchmark against which to assess the deterioration in air quality as the lockdown is eased. At that time, readings were made over twelve locations with three sets of readings taken per day (morning, lunchtime and late afternoon) at each location. Each set comprised an overall index and six main pollutants, giving 1700 pollutant readings in total. Three pollutants – nitrogen dioxide, PM10 particulates and PM 2.5 particulates were selected for detailed analysis.

The monitoring exercise was repeated during the week commencing 8th June. Fourteen locations were monitored i.e. three additional locations and one location replaced from the first set of measurements. The results of this exercise are reported here with 2050 readings, and compared with April/May results. The exercise was further repeated over the same fourteen locations in the week commencing 13th July and these results are reported here.

WHAT WE FOUND

https://drive.google.com/file/d/1bP-K1c_d0Bfo2oLfhMEwKBzsMOputYzi/view?usp=sharing

NITROGEN DIOXIDE AS A POLLUTANT
Compliance with Defra limits
The UK limits are measured in units of micrograms/cubic metre (µ/m3). Exposure is limited to 40µ/m3 on a yearly average and c.100 µ/m3 not to be exceeded more than 18 times per year. WHO advises guidelines of an annual mean of 40 micrograms/cubic metre and a 1 hour mean of 200 micrograms/cubic metre.

Health Impact
There is good evidence that nitrogen dioxide is harmful to health. The European Environment Agency reported that the UK had 11,940 premature deaths in 2013 from nitrogen dioxide. The most common short-term outcomes are respiratory symptoms such as shortness of breath and cough. Nitrogen dioxide inflames the lining of the lung and reduces immunity to lung infections such as bronchitis. Studies also suggest that the health effects are more pronounced in people with asthma compared to healthy individuals.

Sources
Road transport is estimated to be responsible for about 50% of total emissions of nitrogen oxides, which means that nitrogen dioxide levels are highest close to busy roads and in large urban areas. Diesel cars create more nitrogen dioxide. Gas boilers in buildings are also a source of nitrogen dioxide.

Prevention/Mitigation
Reducing traffic would make a major impact on nitrogen dioxide levels. Travel by petrol/diesel car should become the last option for travel after working from home, walking and cycling, electric bikes and cars, and public transport. HGV vehicles are a major source in town centres. Out of town offloading centres with last mile delivery to locations by low emission vehicles would reduce this source.
Energy efficient housing stock, heated by local heat pumps replacing gas boilers, would reduce the levels of this harmful pollutant.

PM 10 AS A POLLUTANT
Compliance with Defra limits
An annual mean of 40 micrograms/cubic metre, together with levels not to exceed 50 micrograms/cubic metre more than 35 times a year. WHO advises guidelines of an annual mean of 20 micrograms/cubic metre and a 24 hour mean of 50 micrograms/cubic metre.

Impact of pollutant
PM10 particles can settle in the airway and deep in the lungs and cause health problems. The health effects of particle air pollution have been widely studied, and include premature death and the worsening of heart and lung disease, often increasing admissions to hospital.
In 2008, the UK’s Committee on the Medical Effects of Air Pollutants reported that the loss of life from particulates is equivalent to 29,000 deaths. More recently studies are investigating the possible link between poor air quality and outcomes such as low birth weight infants and neurological health.

Sources of pollutant
Particles originating from road traffic include carbon emissions from engines, small bits of metal and rubber from engine wear and braking as well as dust from road surfaces. Others include material from building and industry
Wood burning and fires are a source of PM10 particles, as are agricultural emissions where ammonia is converted into particles of ammonium salts. Nitrogen dioxide also reacts with hydrocarbons in the presence of sunlight to create ozone, and contributes to the formation of particulates.
Whilst nitrogen dioxide is predominantly local, particulates such as dust, pollen, sea salt, sand and soil can be carried by the wind and therefore some of the source are national and international.

Ways to improve air quality
Reducing traffic would make a major impact on PM10 levels. Travel by petrol/diesel car should become the last option for travel after working from home, walking and cycling, electric bikes and cars, and public transport. HGV vehicles are a major source in town centres and therefore out of town offloading centres with last mile delivery to town locations by low emission vehicles would remove this source.
Public education on the adverse health impact of fires and wood burning would reduce particulate levels.
Manure management techniques such as those practiced in the Netherlands have been shown to reduce particulates. Local farming practices on manure management should be investigated for areas of improvement.

PM 2.5 AS A POLLUTANT
Compliance with Defra limits
The UK limit for PM 2.5 particulates is an annual mean of 25 micrograms/cubic metre. WHO advises guidelines of an annual mean of 10 micrograms/cubic metre and a 24 hour mean of 25 micrograms/cubic metre. The UK’s Clean Air Strategy should take us a substantial way towards achieving the WHO guideline level for PM2.5 across the country by 2030.

Health impact
PM 2.5 particles can easily work their way into human lungs, bloodstream, brain and other organs which can trigger asthma attacks, allergic responses, heart attacks and stroke.
.
The health effects of particle air pollution have been widely studied, and include premature death and the worsening of heart and lung disease, often increasing admissions to hospital. In 2008, the UK’s Committee on the Medical Effects of Air Pollutants reported that the loss of life from particulates is equivalent to 29,000 deaths. More recently studies are investigating the possible link between poor air quality and outcomes such as low birth weight infants and neurological health. Healthy Surrey states on its website “If we can reduce fine particulate air pollution in England by just 1ug/m3, this could prevent many tens of thousands of cases for coronary heart disease associated with fine particulate air pollution. By 2035, there is strong evidence that this will rise to nearly 350,000 cases”.

Particles originating from road traffic include carbon emissions from engines, small bits of metal and rubber from engine wear and braking as well as dust from road surfaces. Others include material from building and industry and agricultural emissions where ammonia is converted into ammonium salts particles.
In the UK, there are reported to be 1.5 million wood burning stoves in use, with around 200,000 more sold each year. The use of wood in domestic combustion activities accounted for 38 percent of PM2.5 emissions in 2018. Most of these stoves are for pleasure, not for heating.
Whilst nitrogen dioxide is predominantly local, particulates such as dust, pollen, sea salt, sand, soot and soil can be carried by the wind and therefore some of the source is not local.

Ways to improve air quality
Reducing traffic would make a major impact on PM10 levels. Travel by petrol/diesel car should become the last option for travel after working from home, walking and cycling, electric bikes and cars, and public transport. HGV vehicles are a major source in town centres and therefore out of town offloading centres with last mile delivery to town locations by low emission vehicles would remove this source.
Public education on the adverse health impact of fires and wood burning, and in particular the impact on health of wood burning stoves would reduce particulate levels.
Manure management techniques such as those practised in the Netherlands have been shown to reduce particulates. Local farming practices on manure management should be investigated for areas of improvement.
10 steps to set up an air quality programme

If you are concerned about air quality in you area, here is a 10 step process which might be helpful.

  1. Research your local area’s air quality information

2. Decide the objectives of your work

What you want to achieve will determine the approach you need to take. For example, our primary concern in Dorking is to raise our local residents awareness about air quality, because we believe that this will lead to their engagement and acceptance of climate change as an existential threat. Other groups may want to challenge their local authority on areas of concern. Obviously these are not mutually exclusive but these choices will particularly determine the monitoring method you select in Step 4.

So specific objectives might include

  1. Addressing local hotspots with the local authority (LA)
  2. Filling gaps in air quality information, either by your work or by lobbying the LA
  3. Raising awareness and engagement of residents so they become involved in action

3. Set up a team to carry out your programme

A team approach has many benefits particularly creativity and avoiding the vulnerability of over dependence on one or two individuals. In addition to all team members motivation, it is helpful to have skills in the team such as data analysis, an ability to find useful air quality resources and to keep up to date with air quality reports in the media.

4. Select the methods which you will use to monitor air quality

As our primary objective is to engage with residents on air quality, we chose to use Breezometer, which has a mobile phone app. It is free and can measure air pollution levels in any location, irrespective of your location. We hope that residents will begin to use the app.No doubt there are other similar free apps which are also readily accessible.

5. Using the air quality monitor

Using Breezometer, we had to decide which pollutants to measure. We chose to record all six pollutants listed – ozone, carbon monoxide, sulphur dioxide, nitrogen dioxide, PM10 and PM 2.5 – and omitted the overall index, which often gave counter intuitive results.

Whilst we accepted that there was a trade off between ease of use and accuracy, we wanted to understand how accurate Breezometer was. This is ongoing research. If you want to know more, please contact us. We use the data to highlight potential local hotspots and to fill the gaps where local authority data is limited or non existent.

6. Decide the locations you will monitor to achieve your objectives

Based on the local authority report, our own sense of local hotspots and locations of particular interest – schools, motorway junction, remote countryside, drilling site- we chose up to 15 locations to monitor

7. Carry out the monitoring programme

To catch rush hour times, we took readings at 9am, 1300 and 1800 for a week, including weekends. It takes about 10 minutes to monitor and record 3 locations. Setting an alarm on your phone minimises blank data.

8. Analyse the results using e.g. Excel

In a week, we took nearly 2000 readings . It is essential to record and analyse the data using a spreadsheet. This means that, when you repeat the exercise to check how AQ is changing, it is easy to compare periods.

We decided to focus on three pollutants – nitrogen dioxide and the two particulates, but retain the data on the other pollutants for potential later use

9. Communicate the results of your investigation

There are four target groups

  • the media ( who have published our results on their front page on our first two reports ( see Every Breath We Take).
  • our local XR group so they can take outreach opportunities and direct action
  • The local authority to discuss what they are doing as a result of our work
  • Local resident groups who are interested in air pollution

10. Take action on your results

Review, replan, act and share your learning and progress with other XR groups

Surrey Pension Fund Divestment Campaign

Despite long running campaigns to persuade them, the Surrey Pension Fund (SPF) Committee has refused to commit to selling its investments in fossil fuel producers. The most recent data we have (May 2019) showed £151m of investments in oil & gas companies. In response to pressure at the last pensions committee meeting the written response was:

Holding zero fossil fuel investments in the Fund’s portfolio has no impact whatsoever in reducing the impact of climate change

We disagree with that statement on several levels and moreover see continuing to invest in fossil fuel companies as being increasingly risky and inconsistent with the Fund’s other sustainability goals.

Read more about the campaign here.

What can you do?

Join the protest at County Hall in Kingston, 9am on March 13th 2020.

Write an email or letter to the SPF board members. Crib sheet here.


people’s assembly – Feb 8th

Dear Rebels,

How did you feel about the Canning Town Tube action, in week two of last October’s Uprising?   Did it interfere with movement-building and sympathy-winning; or was a necessary disruption in the fight for change?  Or maybe a bit of both?  

Your view is urgently needed on how we – XR local, regional and national – can mix activities to best achieve our aims.  So please come and take part in our first local People’s Assembly, to voice your opinions and to contribute to forward XR strategy. 

The PA will be on Saturday 8 February; 1.30 for a prompt 2.00pm start at The Friends Meeting House, Dorking; conclusion by 4.15 guaranteed.  Short notice I know, but the request from XR central only came on Monday, with a 14 February deadline. 

So please do whatever you have to do to be there, and register your intention to attend by clicking here.  

XR has supplied us with a format for this Assembly, and helpfully condensed the variety of routes forward into three ‘Theories of Change’ (ToC).  To what extent are they complimentary, or competing?  And where can our energies and skills be directed most effectively?  That is what our first People’s Assembly is all about.  If you have time, you can read the ToC papers here, but we will recap on them at the Assembly anyway.  

Do come and join us on Saturday week.  It is important, but it will also be exciting.  So register now.

With Love and Rage – James
James Benn
People’s Assembly Working Group

P.S.  We may be able to organise a play area for small children; if you will be bringing them please note that when registering. 

P.P.S.  Details of final arrangements, and further joining instructions will be sent to all registrants. 

XR Dorking on the BBC

Claire Benn and Christopher Harwood, both members of Extinction Rebellion Dorking, were interviewed yesterday on the BBC Radio Sussex & Surrey Danny Pike show.

They gave their reaction to the inclusion of Extinction Rebellion on a South East Police list of terror organisations which was later described as “an error of judgement” and recalled.

Listen to interview (skip to 1hr 9mins)

Relevant links:

Extinction Rebellion: What do they want and is it realistic?

Can we transform the world in 12 years?