dirty water
Water is vital for life. Our waterways are the veins of our country and home to an incredible number of species and habitats. But our clean water and biodiversity are being sacrificed by politicians’ failure to legislate and regulate effectively against pollution. In 2020, 0% of rivers in England were classified as being in good health, due in large part to pollution from sewage discharges and agricultural run-off.
Climate change is increasing the likelihood of heavy or intense rainfall in many parts of the UK, particularly in the winter months. This is leading to higher risks of river and surface water flooding, which in turn increases the pressure on our antiquated and underfunded water and sewage systems. Due to lack of regulation and legislation, water companies are using this as an excuse to pump pollution into our waterways more frequently.
‘storm overflows act as a safety release valve, but were intended only for exceptional circumstances when the public would be unlikely to be using rivers.
After the Environment Agency required the water industry to install monitors on overflows, data shows that their use is now not exceptional. In some cases, up to 200 discharges a year are occuring. This is obviously unacceptable on public health grounds.’
Joint opinion piece from Professor Chris Whitty, Chief Medical Officer for England, Jonson Cox, Ofwat chair and Emma Howard Boyd, Environment Agency chair
Planet Patrol’s ‘What Lies Beneath Report 2022’ found that the River Mole was amongst the worst for water quality, failing to meet acceptable levels of nitrate, phosphate, total coliform and pH levels.
We are taking part in the nationwide Dirty Water campaign to shine a light on the causes of water pollution and to join with other local groups who are working to find solutions to clean up our waterways.
Please do get in touch if you, or anyone you know, would like to be involved or share information on issues relating to our local river.
You can read about Wave 1 of the Dirty Water campaign here
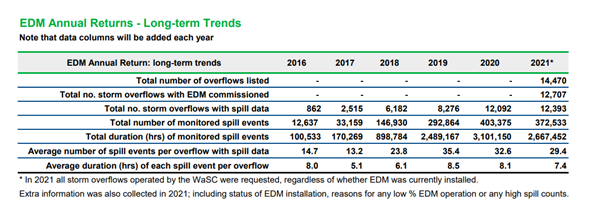
The chart from the Environment Agency below shows how the levels of sewage discharges increased from 2016-2021: